How to debug a Hyperlight KVM guest using gdb
Hyperlight supports gdb debugging of a KVM guest running inside a Hyperlight sandbox.
When Hyperlight is compiled with the gdb feature enabled, a Hyperlight KVM sandbox can be configured
to start listening for a gdb connection.
Supported features
The Hyperlight gdb feature enables KVM guest debugging:
- an entry point breakpoint is automatically set for the guest to stop
- add and remove HW breakpoints (maximum 4 set breakpoints at a time)
- add and remove SW breakpoints
- read and write registers
- read and write addresses
- step/continue
- get code offset from target
Expected behavior
Below is a list describing some cases of expected behavior from a gdb debug session of a guest binary running inside a KVM Hyperlight sandbox.
- when the
gdbfeature is enabled and a SandboxConfiguration is provided a debug port, the created sandbox will wait for a gdb client to connect on the configured port - when the gdb client attaches, the guest vCPU is expected to be stopped at the entry point
- if a gdb client disconnects unexpectedly, the debug session will be closed and the guest will continue executing disregarding any prior breakpoints
- if multiple sandbox instances are created, each instance will have its own gdb thread listening on the configured port
- if two sandbox instances are created with the same debug port, the second instance logs an error and the gdb thread will not be created, but the sandbox will continue to run without gdb debugging
Example
Sandbox configuration
The guest-debugging example in Hyperlight demonstrates how to configure a Hyperlight
sandbox to listen for a gdb client on a specific port.
CLI Gdb configuration
One can use a gdb config file to provide the symbols and desired configuration.
The below contents of the .gdbinit file can be used to provide a basic configuration
to gdb startup.
# Path to symbols
file path/to/symbols.elf
# The port on which Hyperlight listens for a connection
target remote :8080
set disassembly-flavor intel
set disassemble-next-line on
enable pretty-printer
layout src
One can find more information about the .gdbinit file at gdbinit(5) .
End to end example
Using the example mentioned at Sandbox configuration one can run the below commands to debug the guest binary:
# Terminal 1
$ cargo run --example guest-debugging --features gdb# Terminal 2
$ cat .gdbinit
file src/tests/rust_guests/bin/debug/simpleguest
target remote :8080
set disassembly-flavor intel
set disassemble-next-line on
enable pretty-printer
layout src
$ gdbUsing VSCode to debug a Hyperlight guest
To replicate the above behavior using VSCode follow the below steps:
To use gdb:
- install the
gdbpackage on the host machine - install the C/C++ Extension Pack extension in VSCode to add debugging capabilities
- install the
To use lldb:
- install
lldbon the host machine - install the CodeLLDB extension in VSCode to add debugging capabilities
- install
create a
.vscode/launch.jsonfile in the project directory with the below content:{ "version": "0.2.0", "configurations": [ { "name": "LLDB", "type": "lldb", "request": "launch", "targetCreateCommands": ["target create ${workspaceFolder}/src/tests/rust_guests/bin/debug/simpleguest"], "processCreateCommands": ["gdb-remote localhost:8080"] }, { "name": "GDB", "type": "cppdbg", "request": "launch", "program": "${workspaceFolder}/src/tests/rust_guests/bin/debug/simpleguest", "args": [], "stopAtEntry": true, "hardwareBreakpoints": {"require": false, "limit": 4}, "cwd": "${workspaceFolder}", "environment": [], "externalConsole": false, "MIMode": "gdb", "miDebuggerPath": "/usr/bin/gdb", "miDebuggerServerAddress": "localhost:8080", "setupCommands": [ { "description": "Enable pretty-printing for gdb", "text": "-enable-pretty-printing", "ignoreFailures": true }, { "description": "Set Disassembly Flavor to Intel", "text": "-gdb-set disassembly-flavor intel", "ignoreFailures": true } ] } ] }jsin
Run and Debugtab, select eitherGDBorLLDBconfiguration and click on theRunbutton to start the debugging session. The debugger will connect to the Hyperlight sandbox and the guest vCPU will stop at the entry point.
How it works
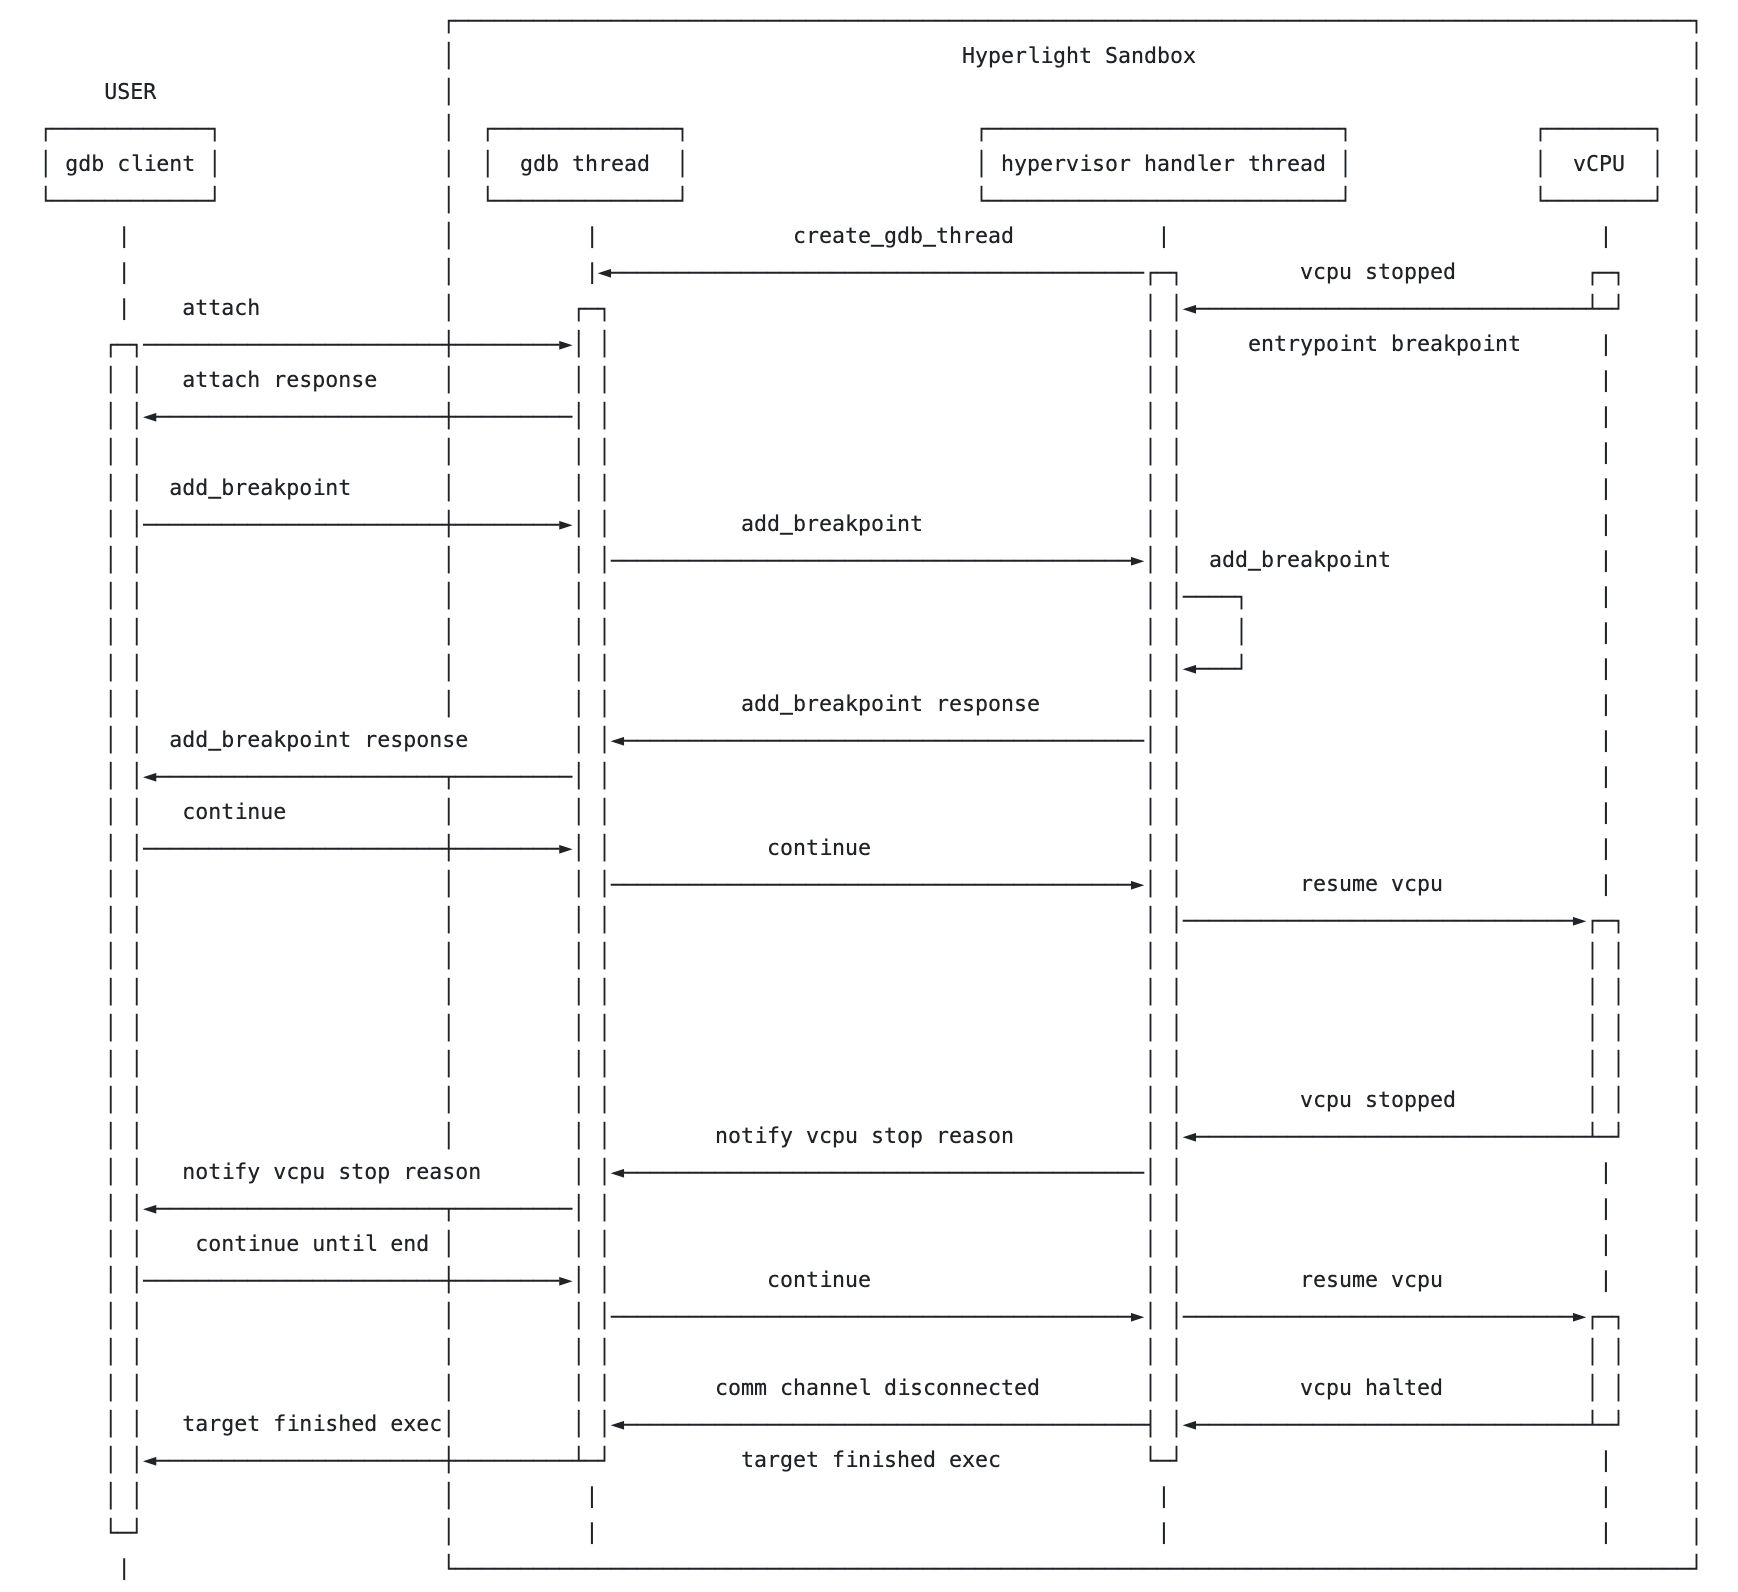
The gdb feature is designed to work like a Request - Response protocol between a thread that accepts commands from a gdb client and the hypervisor handler over a communication channel.
All the functionality is implemented on the hypervisor side so it has access to the shared memory and the vCPU.
The gdb thread uses the gdbstub crate to handle the communication with the gdb client.
When the gdb client requests one of the supported features mentioned above, a request
is sent over the communication channel to the hypervisor handler for the sandbox
to resolve.
Below is a sequence diagram that shows the interaction between the entities involved in the gdb debugging of a Hyperlight guest running inside a KVM sandbox.